Projects
This post presents my recent work on a big-data problem. The purposes are to corroborate my research and describe a collection of codes that aim to promote scalable computation, automation and reproducibility.
Understanding and monitoring financial system hinge on reliable and timely measurements of market-wide systemic risk. They are indispensably critical for the central bank and policymakers to maintain a healthy and stable economy.
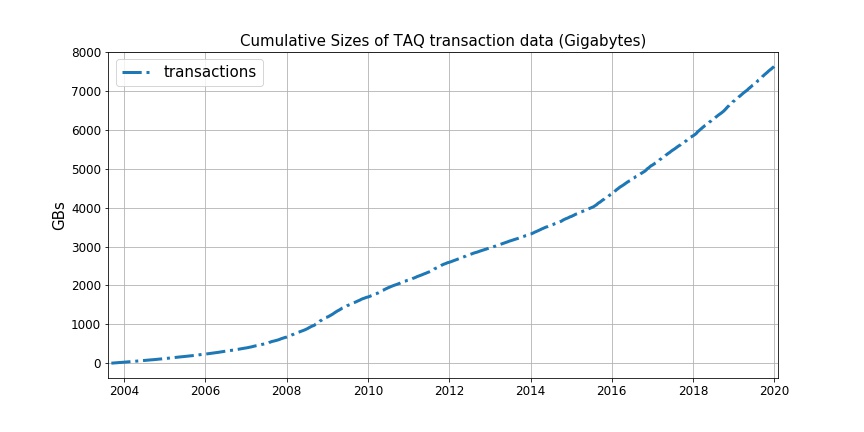
TAQ provides data recorded at the millisecond level and is rapidly growing by approximately 1000 gigabytes per month. The overwhelming amount of high-frequency data unveils a golden opportunity yet poses significant challenges in measuring risk on a large scale.
This big-data problem has become an overarching theme in my Ph.D. dissertation. My previous research battled with some conceptual, methodological and theoretical challenges in the study of microstructure and volatility.
Recently, I spent some time applying my theoretical results to one particular statistical task – PCA (principal component analysis) – by implementing a few software packages to march across 7632.91 GBs of transaction data spanning more than 16 years. This is the focus of this post.
Why
This foray into database query and big-data computation is stimulated by (1) my data science ideal, (2) plight of some of my fellow graduate students:
-
A scientific theory, as Karl Popper emphasized, should in principle be disprovable/falsifiable by experiment or observation. In the same vein, data science needs to be reproducible to be scientific. To promote reproducibility, I hope that my empirical research could be based on open data and open softwares. To this end, I decided to choose a datebase that is open to academia, and write an assortment of codes that automize all the data query and computation tasks without human intervention, so that my peers and colleagues will be able to reproduce my results pretty conveniently (no more than 48 hours using the WRDS Cloud cluster).
-
Another reason is to some extent personal. It took my friend 3 months to download, clean, organize some large datasets from TAQ before being able to proceed with the statistical analysis. It is a heartbreaking story of a back-breaking job. Not only consuming time, it costs money too! Another friend working with Datastream had to purchase an expensive desktop last September with sufficient RAM to read in data from the local hard drive.
In the light of these, what can I contribute? It would be wonderful if we have a data pipeline that
- inquires data by a few scripts;
- cleans data on the server;
- computes statistics on the fly;
- saves final results ready to download;
-
allows you to lie on a sunny beach musing over what’s your next paper while it is running data for you, instead oftoiling, sweating, bleeding through your current project.
If these are attainable, not only can results be easily reproduced, but also downloading and hand-cleaning become unnecessary.
Kill two birds with one stone! Can we?
Yes we can. (not a political slogan ![]() )
)
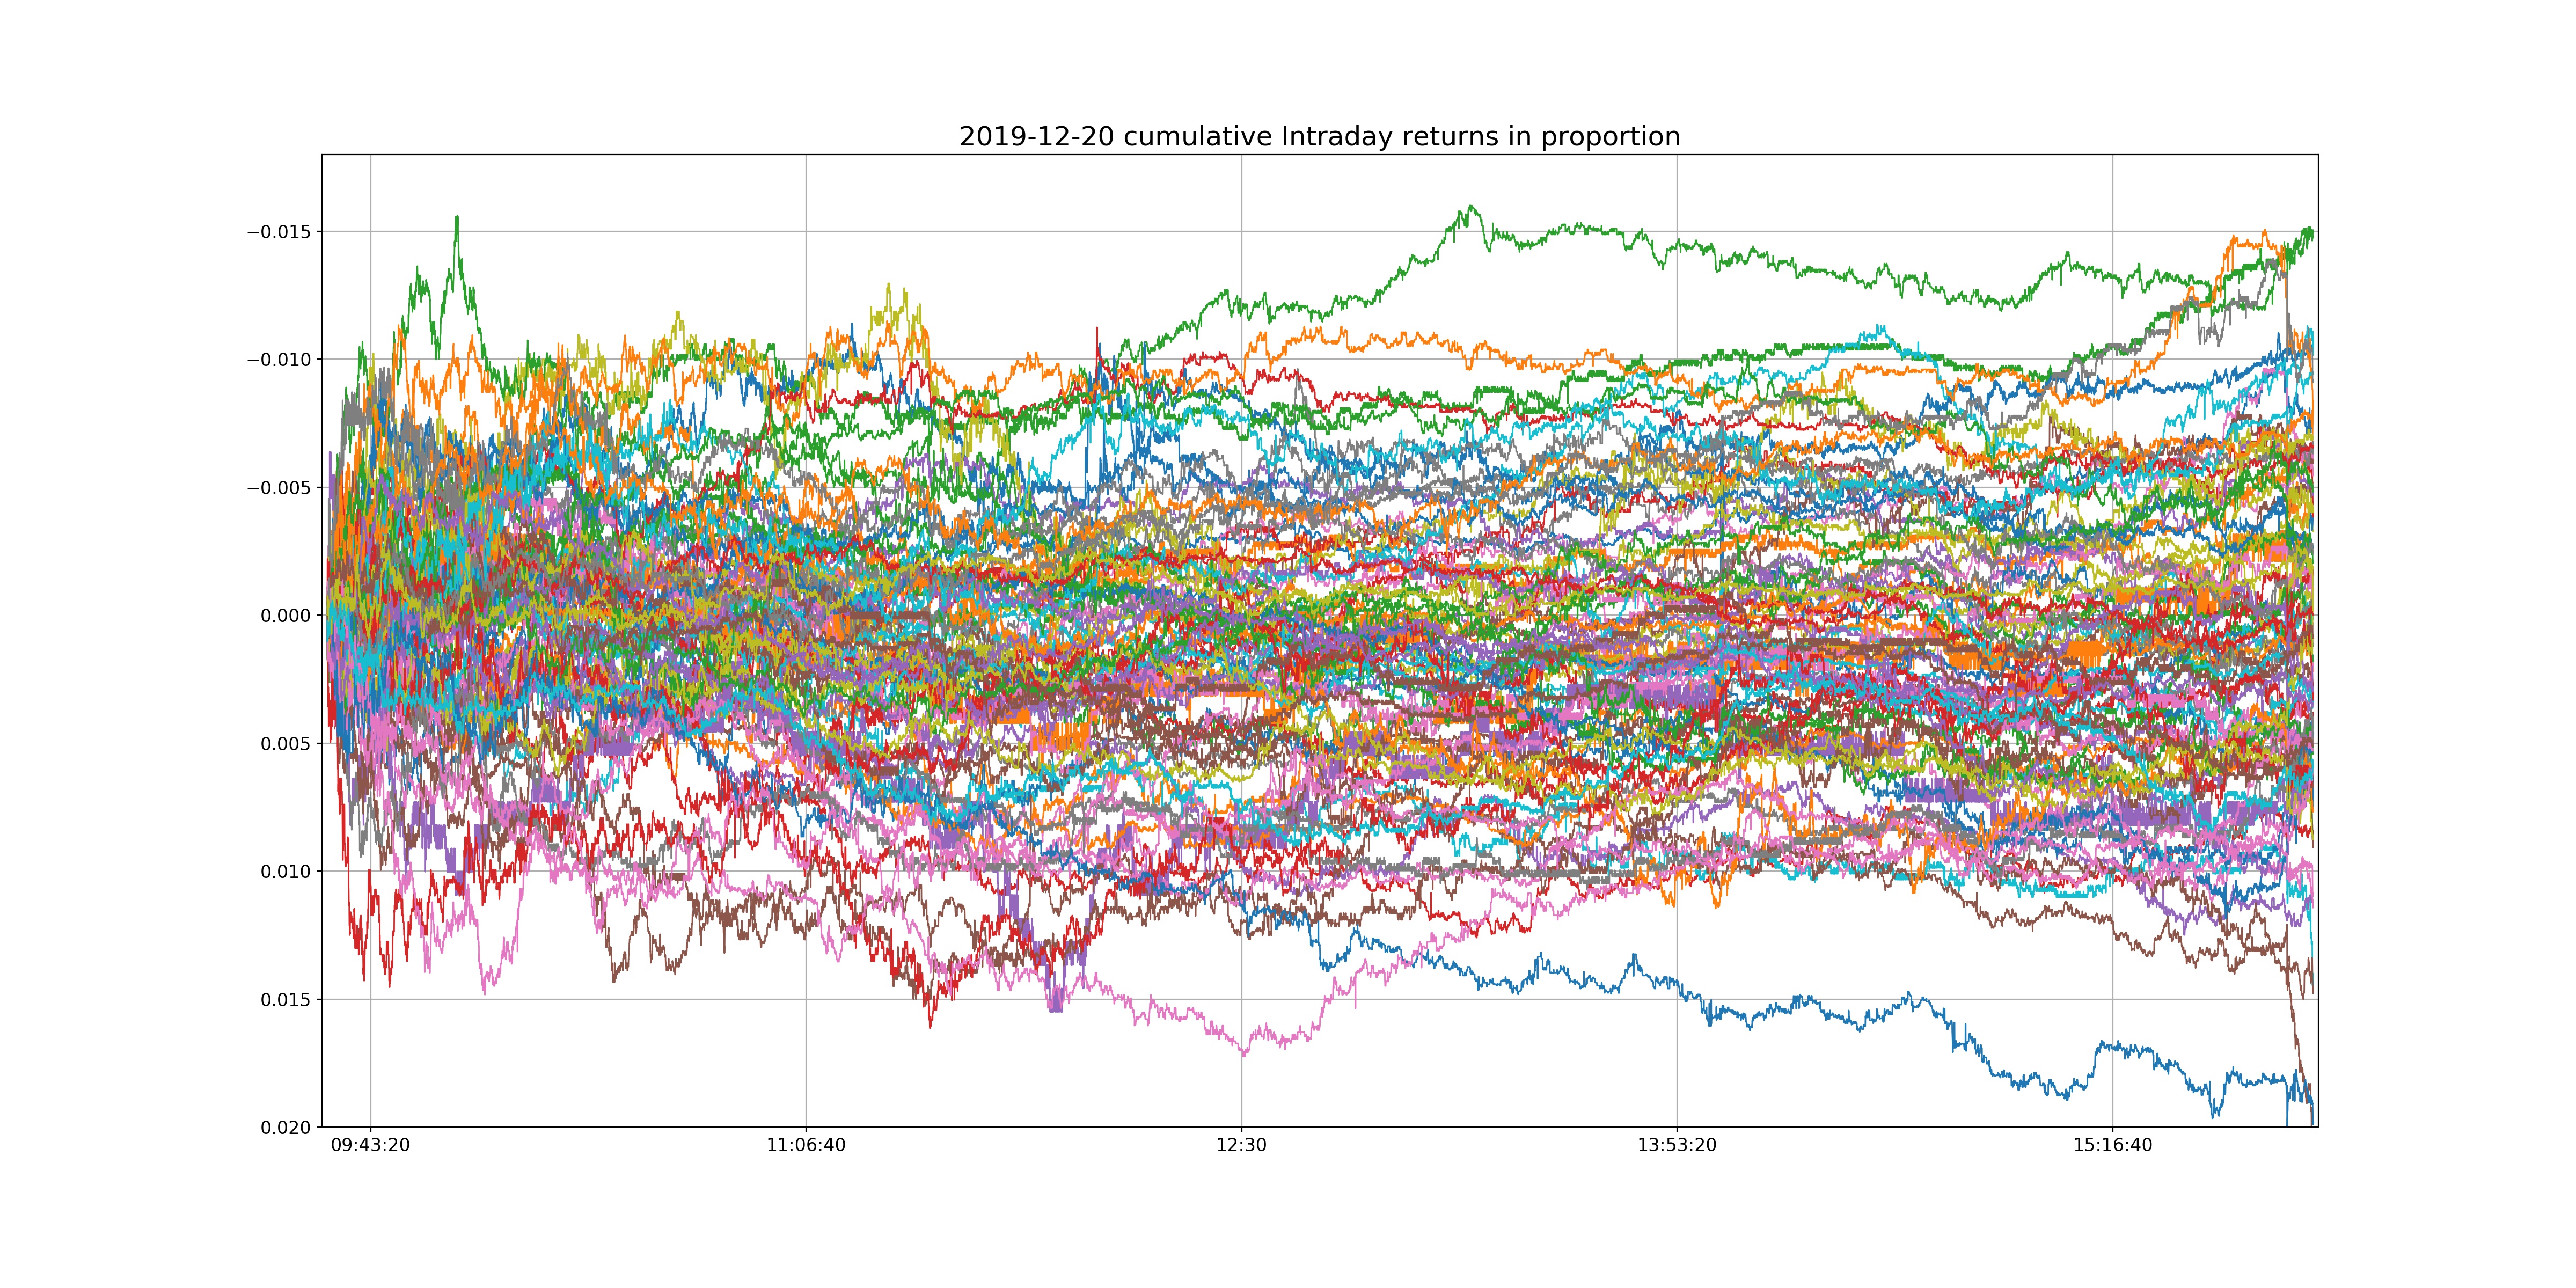
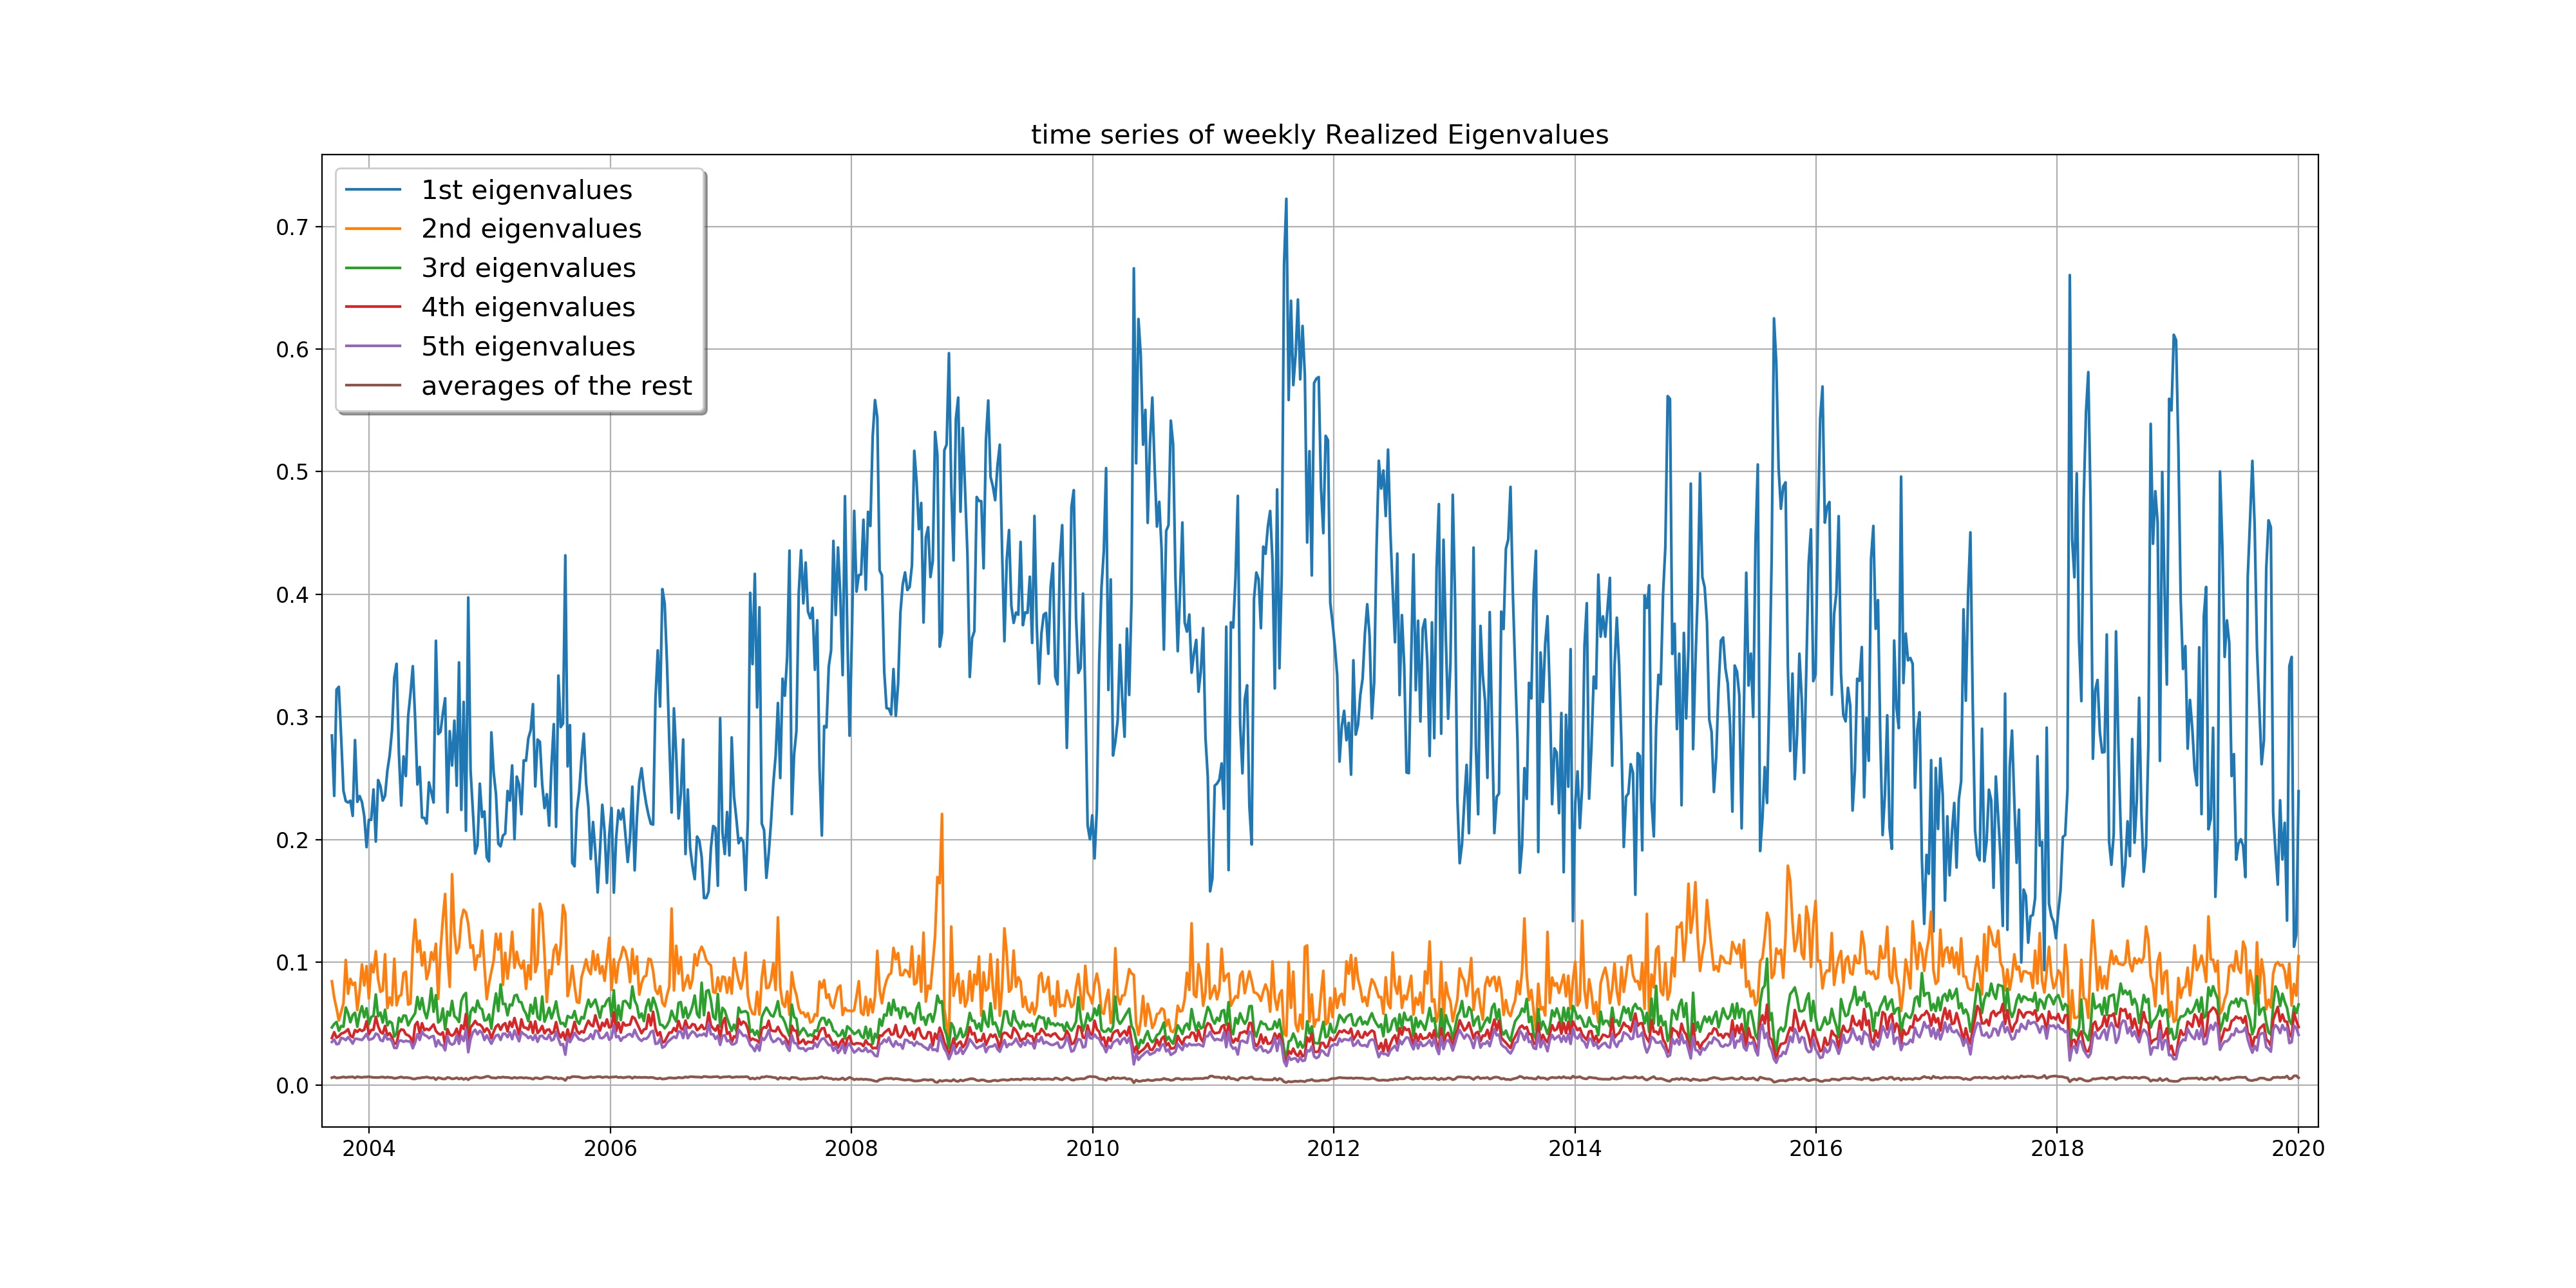
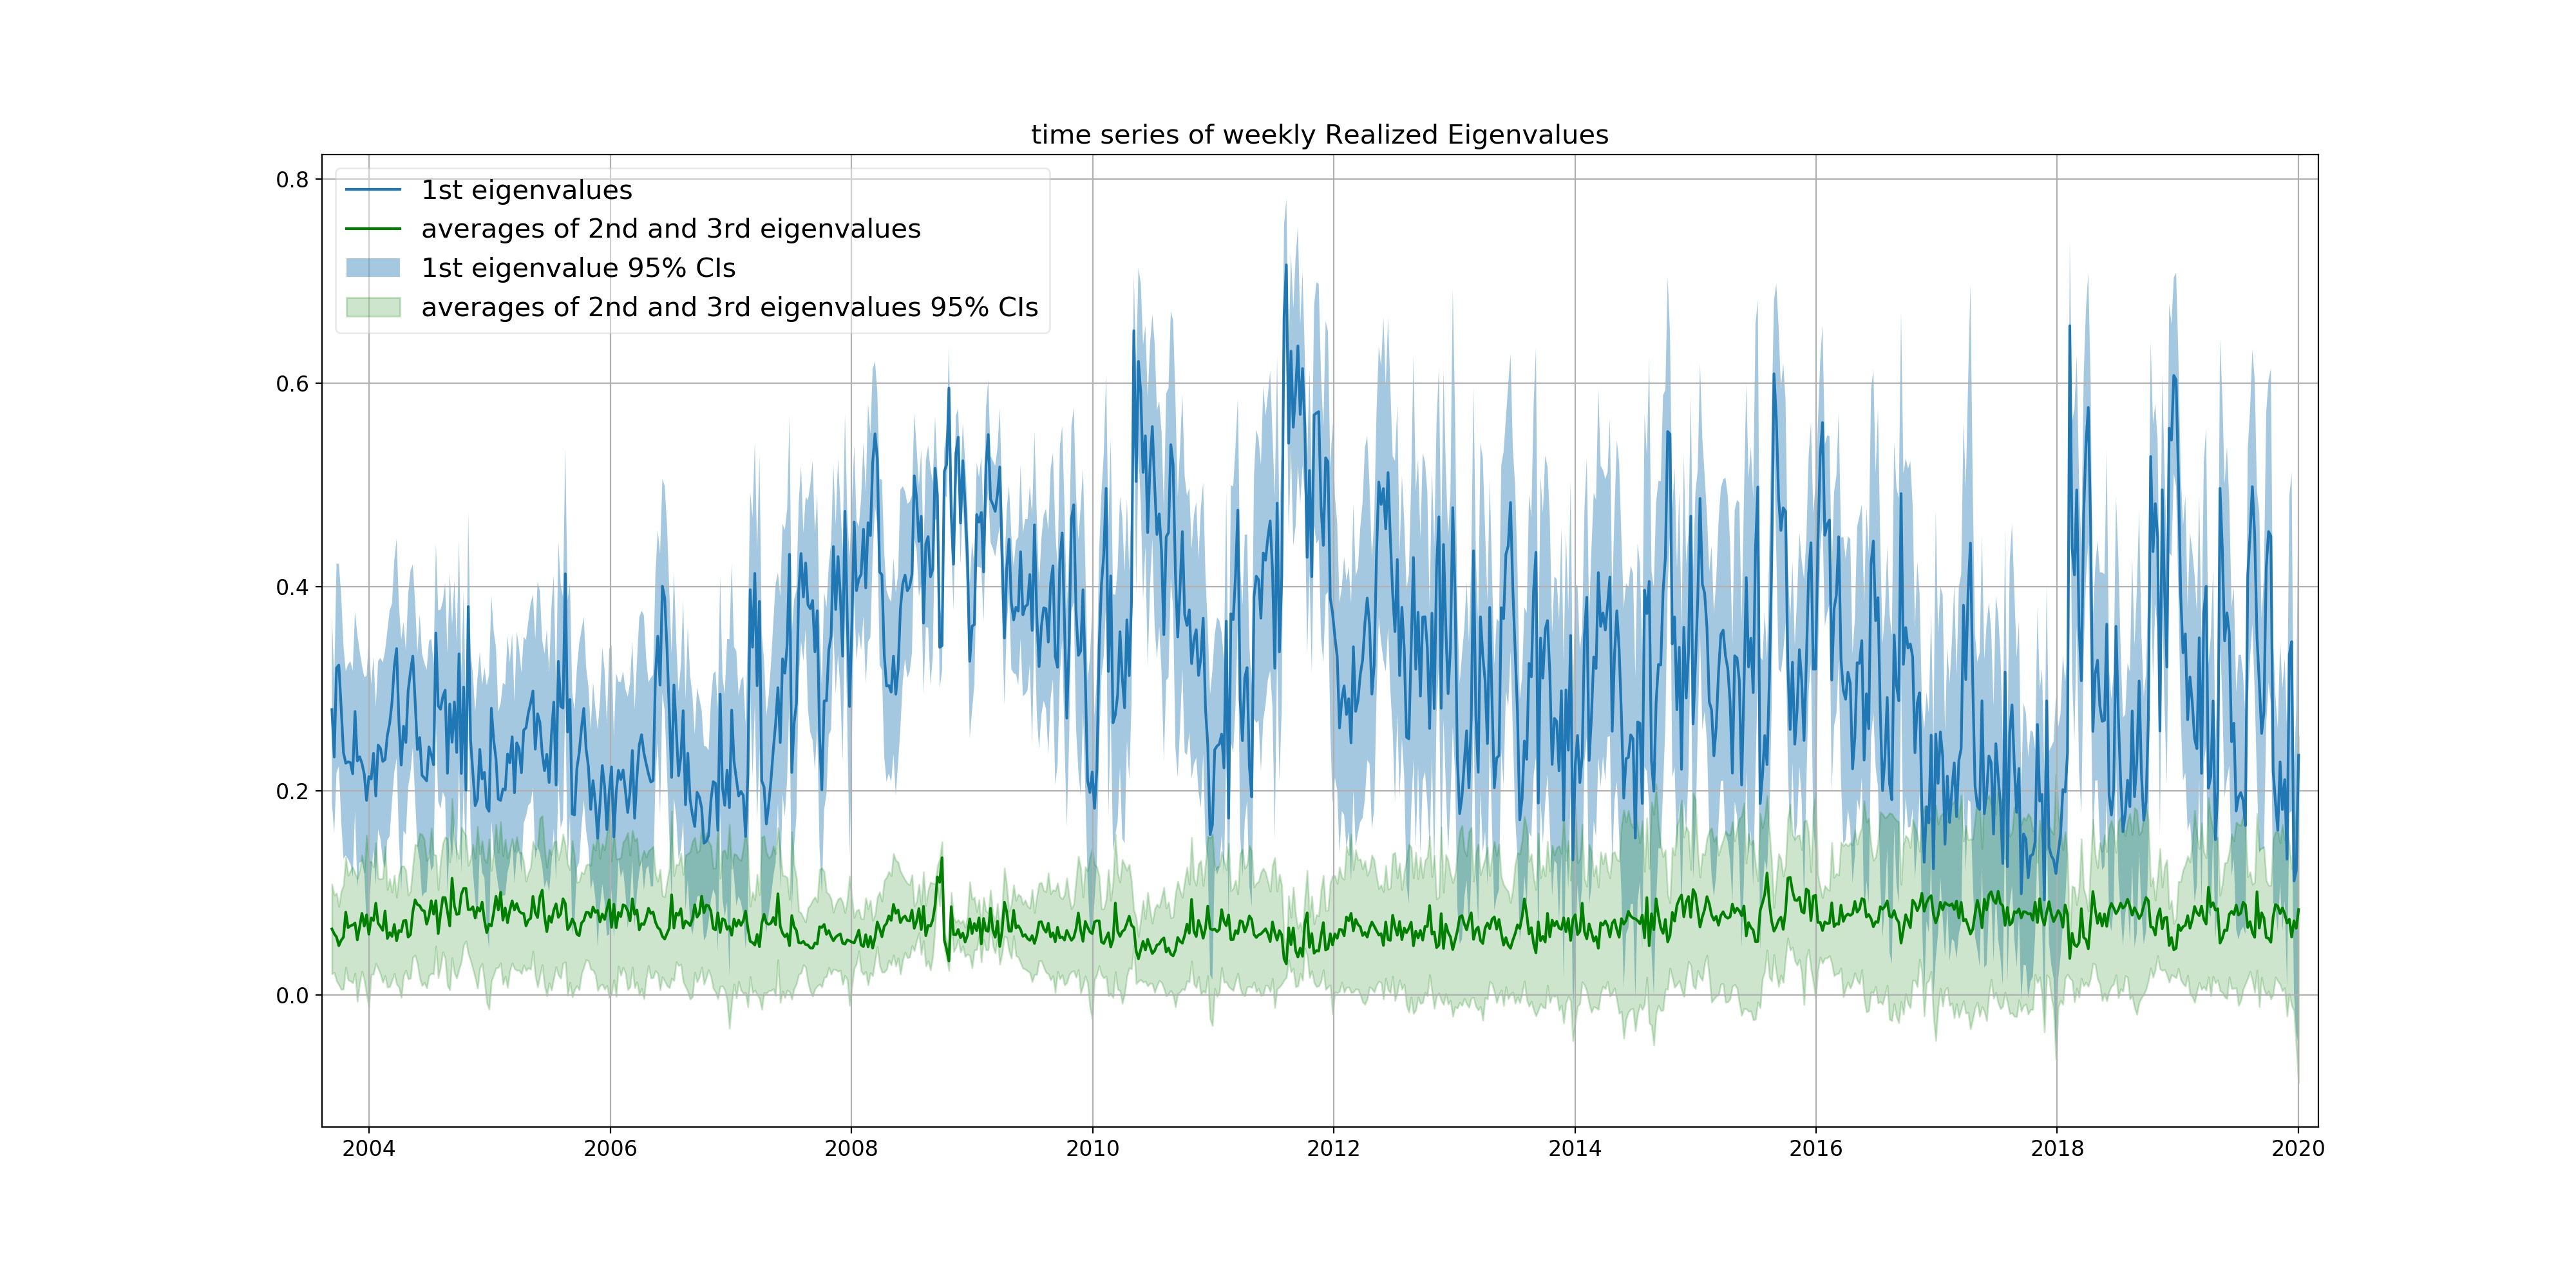
For example, below is a plot (click to zoom in) produced by my automatic data pipeline after it scanned through 7632.91 GBs of data on WRDS server.
Based on Corollary 1 of my paper, we can quantify the statistical uncertainty and compute confidence intervals.
How 
There are several softwares that work to our computational advantage.
PostgreSQL is a open-source database management system adopted by WRDS. It greatly facilitates data query. It has been configured by WRDS and we do not need to work out its backend ourselves.
wrds is a free module written by WRDS. It establishes connection to the PostgreSQL server and seamlessly accesses data in the format of pandas DataFrame. To submit customized query requests, only elementary SQL syntax is needed.
pandas is a fantastic (and free) data science library built on top of numpy. pandas offers expressive data structures and make it pretty easy to work with tabular and time series data.
However, the WRDS engineering team still faces a substantial task of maintaining the humongous and expanding database. SQLAlchemy sometimes raises an operational error canceling statement due to conflict with recovery when data query (the most time-cosuming part of this pipeline with SQL machinery behind the scene) runs for more than 6 hours. Besides, the database server occasionally experiences a communication glitch with the LDAP server (for authentication), which prohibits the connection to be reestablished.
Due to these constraints, the current pipeline is only partially automatic and needs human care every few hours. Rather than looping over all the data at once, we currently need to submit batch jobs to scan subsets of data which can finish in less than, for example, 6 hours. If you decide to leave for the beach, please bring a ssh-capable device with you.
More to come, data and pipeline.


